Weekly Scorecard (New and Revised) 12-21-09
I am starting a new format for the Weekly Scorecard. I am including both West Bellevue and South Bellevie. This is just the start in transitioning this website to one that addresses all of Bellevue. Instead of a narrative I am putting the information in spreadsheet format. This way we can see trends like in the Distrssed Inventory Report.
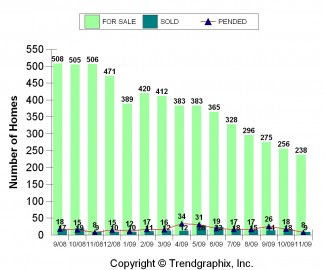
A couple of comments. Overall the activity remains surprisely high but as I have mentioned in other post pricing seems stuck. East Bellevue has good numbers this week but the per sq. ft. price was right at the usual $225. In the other markets we will see how trends develop. In West Bellevue there were only three closed sales and one of them was essentially a land sale of a very small tear down home so the numbers were skewed. What really was of interest was in South Bellevue where a home on the Golf Course in The Reserve at Newcastle finally closed. This home was owned by the FDIC as a result of its take over at Westsound Bank. This home had a number og offers on it, mainly netween a $1,000,000 and $1,100,000 before it want back. It took the FDIC forever to determine the value and get the home back on the market. It was listed at $1,265,000 and was on the market for 15 days. It looked like a bidding war started and the home actually closed at $1,371,000. As I see the new construction inventory depleting I see more and more of these homes going over the asking price for the bank owned homes. The MLS number on this home is 290148809 if you want to check it out. Many purchasers are tiring of the short sales and when a bank owned home can be obtained where a timely closing can occur then it seems to attract a lot of interest from those buyers. There is also one bank owned home in West Bellevue on Evergreen Point road that went pending this week I suspect the same thing happened; there was a bidding war and it went over the listing pricing. New homes in good condition seem to be in demand. Also in addition to the spreadsheet I have attached a graph showing the dwindling new construction inventory.
Spreadsheet Link with Weekly Scorecard: Weekly scorecard 12-21-09
This Graph Below is for all New Construction on the Eastside from $800,000 to $3,000,000


