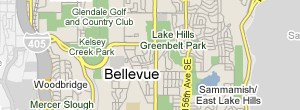
Monthly Numbers
The monthly numbers for Bellevue are now posted. Inventories are starting to rise a bit, but the sales were also very strong. Prices remain stable. The per sq. ft. sales numbers are very stable. West Bellevue is a little misleading because there were two large waterfront sales in those numbers. If you look at the trend line it is at $300 per sq. ft. for the baseline for west Bellevue. The blips up reflect one time large sales. All of the per sq. ft. sales graphs are very stable. The price averages move around as the size and style of the homes change. When the per sq. ft. prices start moving up it is a sign of appreciation.
Sellers seem to have seen the increased sales volumes and are starting to bring property to the market. It appears that as sales occur more inventory waits in the wings to be brought to the market and the market is in a churning mode.
Here is the link for the Stat: http://eastbellevuere.com/index.php/category/statistics/monthly/


