Distressed Inventory Report 10-24-09
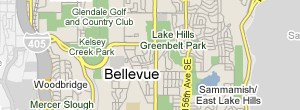
Hello everyone. There is a new addition to the Distressed Inventory Report. By Popular demand I have added West Bellevue (98004) and South Bellevue (98006). Also the website is going to be expanded to be a Bellevue website as opposed just specializing in East Bellevue. Seems folks from the other neighborhoods would like to get the Stats for their markets. There is no historical record for these two new zip codes but as the weeks go by you will see the trend lines developing. However if you want to get an idea of a market’s overall direction without historical data look at the ratio of NTS/Foreclosure (NTS/FO). In general markets that have a large amount of distrssed inventroy will see many more NTS (Notice of Trustee Sale) than foreclosed homes. If you look at the East Bellevue historic numbers you see that on August 8th you have 90 homes total with an NTS/FO Ratio of 4.625. This means for every foreclosed home there was 4.625 NTS homes. Intuitively you can imply the amount of foreclosed homes rise because not all NTS homes will be successfully short sold or have their loans successfully renegotiated. Conversly as the ratio falls it means there is less potential NTS invetory which will be converted to a foreclosed bank owned home. If you look at the West Bellevue ratio of 1.0645 you can see that this is almost even because for every bank owned home there is only one short sale home. If you look at the West Bellevue numbers on the surface with 5 new foreclosed homes you would think wow what a big jump in bank owned inventory which is true. However what is really happening is that the overall distressed inventory is working down since there is a dwindling amount of NTS inventory to supply the foreclosure pipeline. From this I would make the argument that this market is actually in recovery with those borrowers or lenders throwing in the towel and taking the home back to dispose of it. The key factor is the overall distressed inventory not just the foreclosed homes. Home foreclosure is the cumulnation of an extended process for a borrower under extreme financial pressure. These foreclosures you see now reflect economic conditions put in place over a year ago. The NTS reflect borrower circumstances from about six months ago. In most markets the largest downward pressure on prices is not put on by the bank owned homes but the short sale homes. These borrowers are at the height of their economic distress and their main emphasis is to get a deal at any price to show a lender.
I will have more commentary on this week’s report a little later in the week but the interesting numbers for me were in East Bellevue on the listed MLS inventory which took a big jump. Looks like some of this short sale and foreclosed properties are finally coming to the market.
Click on the link for the spreadsheet. It is getting pretty large and I have added grid lines and color coding to help.
Bellevue Foreclosure Report 10-24-09


