Weekly Score Card 7-6-09
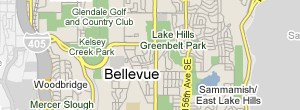
Well things appear to continue to stabilize in East Bellevue. The number of listings was 290 which is right in between the low last week of 287 and the week previous at 295. Generally when you see an increase in sales volumes listings follow but that has not been the case. If you start seeing some firming in prices or a little uptick that will probably kick loose some potential sellers. On the surface the bank inventory appears to be going down. This week there was only 4 bank owned homes on the market an increase of one home that was a result of a failed pending sale. In the sold homes this week, of which there 14,¬† there was no bank owned homes and only one short sale. This is a really low number. Keep in mind this number only reflects those homes which the agent checks the bank owned box on the MLS listing. Some agents don’t do this, I know of at least four other homes which are bank owned but the box on the listing is not checked and not all foreclosures are listed in the MLS but in general having numbers these low is pretty unique in any market area.
The sales this week came in at 14 refelecting the spring bounce that happened in April in May as those pendings now close. There was one waterfront in those sales at $1,600,000 that brought all of the numbers up but even deleting that sale from the rest of the stats the average sale price was at $570,243 but more importantly we saw the first meaningful uptick in the per sq. ft. sales price which came in at $235 per sq. ft. again this is with the waterfront home removed. If the waterfront home was left in it would have been $251. This is the first significant movement we have seen since March where the average per sq. ft. sales price bottomed at about $220 per sq. ft. and stayed stuck at that number until this week. In addition the pending sales came in at $238 per sq ft. but there were only three pending sales. This is the second week we have seen the pending sales volume decline. The average sale price for a pending sale was $622,200 but with only r homes this doesn’t mean much.
It appears¬†that much of the bank owned and some of the short sale inventory is getting cleared out and the lower volumes of those homes coming through as sold and pending are starting to show in the numbers. However as the sale numbers appear to move up in both average price and price per sq. ft. the volumes appear to be dropping.¬† In general you always have your spring burst and then the summer doldrums but my gut feel is that if prices rise anymore the buyers will start sitting on the fence and let inventories build and drive those prices back down. Especially if interest rates head up. Also speaking of interest rates they were down somewhat this week to under 5.5% but not a whole lot.¬† Let’s see what happens in the next 3 to 4 weeks.


