Monthly
Monthly Bellevue Real Estate Statistics
The following charts of Bellevue real estate statistics are updated monthly.
Jump to…
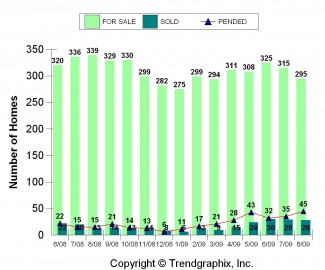
- For Sale Homes vs. Sold Homes
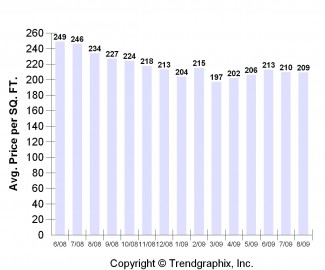
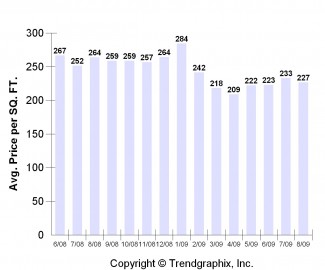
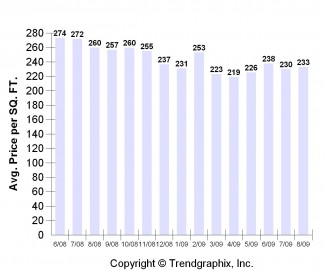
- Average Price Per Sq. Ft.
- Sold Price vs. Asking Price
- Months of Supply
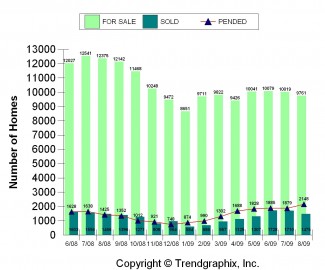
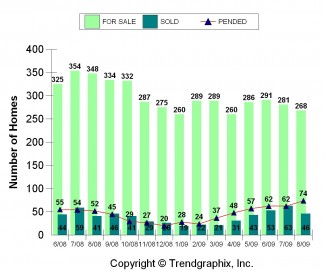
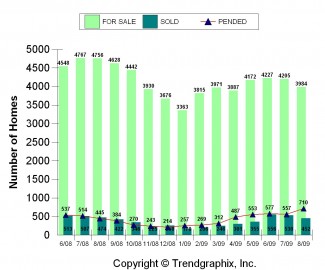
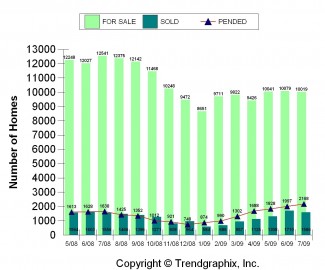
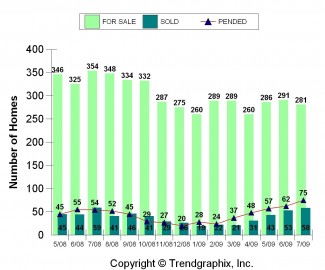
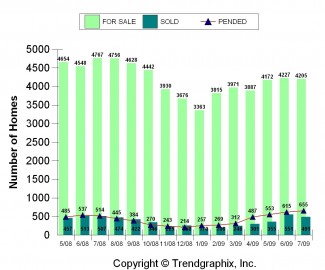
For Sale Homes vs. Sold Homes
East Bellevue (NWMLS Area 530)
West Bellevue (NWMLS Area 520)
South of I-90 (NWMLS Area 500)
Eastside
New Construction Eastside
King County
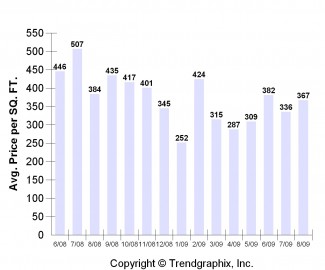
Average Price Per Sq. Ft.
East Bellevue (NWMLS Area 530)
West Bellevue (NWMLS Area 520)
South of I-90 (NWMLS Area 500)
Eastside
New Construction Eastside
King County
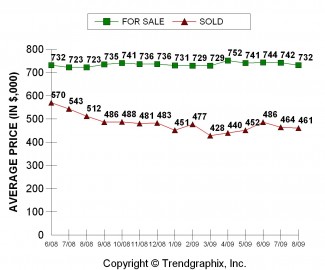
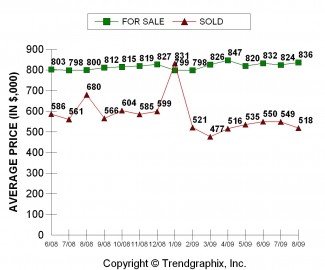
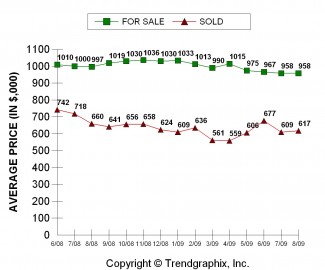
Sold Price vs. Asking Price
East Bellevue (NWMLS Area 530)
West Bellevue (NWMLS Area 520)
South of I-90 (NWMLS Area 500)
Eastside
New Construction Eastside
King County
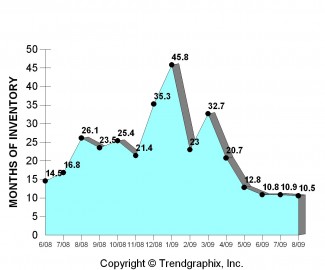
Months of Supply
East Bellevue (NWMLS Area 530)
West Bellevue (NWMLS Area 520)
South of I-90 (NWMLS Area 500)
Eastside
New Construction Eastside
King County
Tags: Monthly, stats
Discussion: No Comments
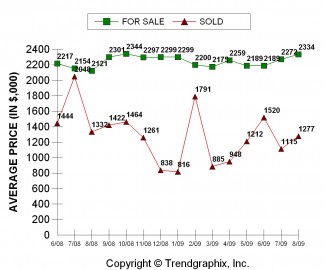
August 2009: For Sale Homes vs. Sold Homes
Tags: 2009, august, For sale, inventory, sold
Discussion: No Comments
August 2009: Price Per Sq. Ft.
Tags:
Discussion: No Comments
August 2009: Average For Sale Price vs. List Price
Tags: 2009, august, Average Sale Price, Monthly
Discussion: 1 Comment
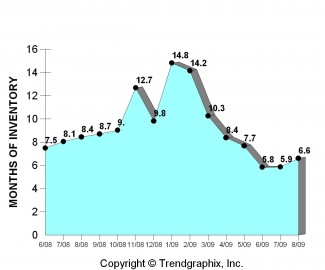
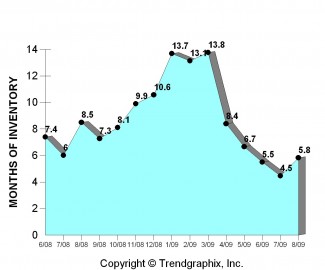
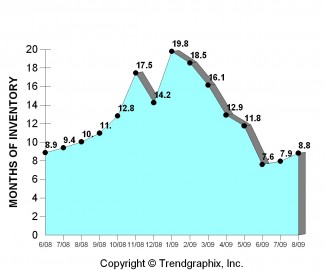
August 2009: Months of Supply
Tags: inventory, Monthly, months, Statistics
Discussion: No Comments
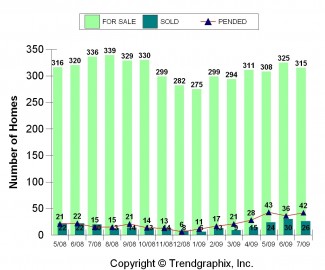
July 2009: For Sale Homes vs. Sold Homes
Tags: 2009, Category, For sale, For Sale ve Sold, inventory, July, sold
Discussion: No Comments
